Contact Us
Whether you're an investor, investee or a part of a leadership team seeking to increase value creation, our strategic consultants are on hand to guide you through your leadership journey. Contact us today.

August 18th, 2022
While large corporates are blessed with the budgets and time to hire a range of specialist leaders within each business function, startups and fast-growth companies don’t usually have the same luxury. Business founders and CEOs must quickly weigh up where to best invest their leadership capital, deciding which functions to focus on first, and then find the right fit with their culture, current team, and business structure. Getting this leadership balancing act right can make the difference between fast growth, average growth – or no growth at all.
Yet, for fast-growth businesses, it isn’t unusual for leadership hires to be driven by where the founder or CEO has the most knowledge, experience, and contacts, as this is where they feel most comfortable. The danger of this is that you can end up with a group of similar individuals, and an imbalance in the team, with gaps in the knowledge and experience needed to grow important strategic areas of the business. Expanding an organisation in a way that is functionally appropriate for the company’s stage of growth is an important lever for success, but it is a considerable challenge – and requires a more scientific and data-driven perspective.
We’ve all seen traditional ‘org charts’, used to show hierarchy and reporting structures in a business. But beyond knowing who reports to whom, what value do these charts provide? What if instead we had access to a dynamic leadership chart, drawing on real data to visualise the functional experience within the leadership team, optimize the spread of experience, and even predict leadership team success? This is the role of a Functional Balance Chart.
Functional balance refers to the make-up of the leadership team, its structure, and whether it has the right representation and depth within the key leadership areas (e.g., finance, IT, operations etc.) A Functional Balance Chart enables us to visualise this balance (or imbalance), by plotting each leader’s experience on axes, ranging from Strategic to Tactical, and Value Creation to Value Measurement/Delivery. The size of each leader’s circle on the chart refers to the amount of experience they have overall.
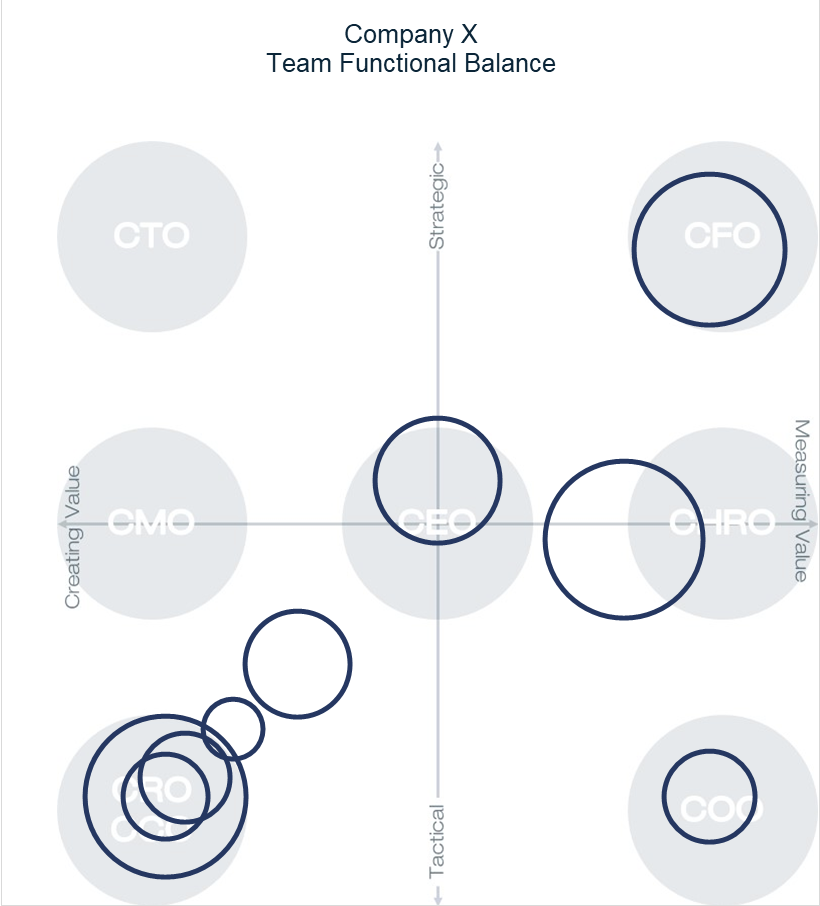
You can see that each leadership function has an Archetype on the chart (the grey circles) based on how they drive value and performance in the business. For example, the CFO is strategic and primarily involved in measuring value, whereas the CTO is strategic but a creator of value.
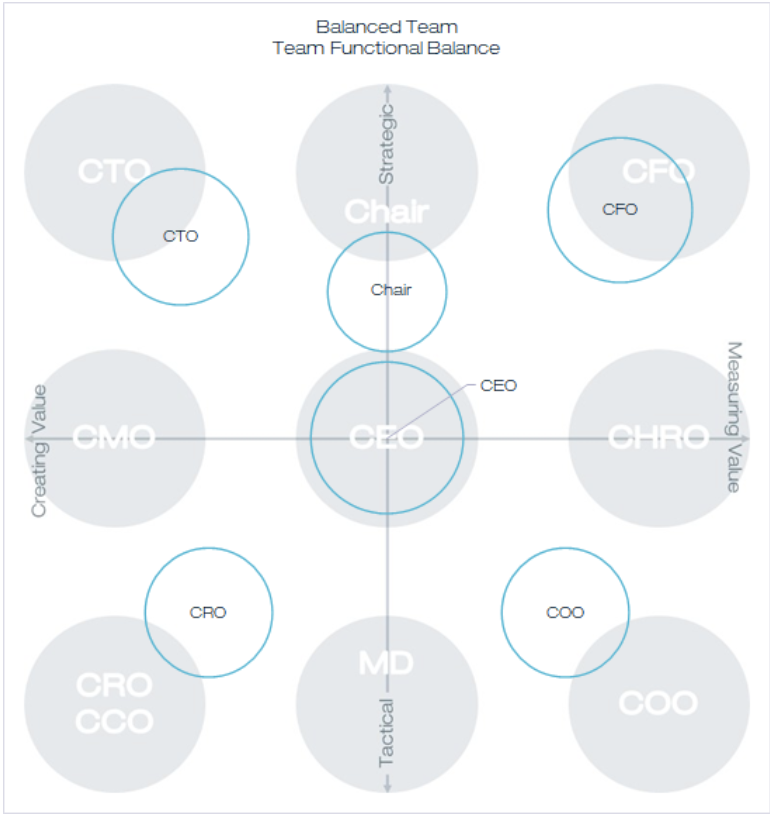
The overall result is a single view of where each team member sits in relation to both their role Archetype and the other leaders in the business. And, as you might expect, our research has found that the optimal distribution is to have a good balance across the quadrants, to ensure that all functional competencies are covered. Below is a real example of what a reasonably balanced team looks like, with a functional leader in each of the four quadrants and with the CEO falling in the centre, to establish cohesion and create a unified team.
However, if the team were smaller, with only three leaders for example, then the ideal chart would shift. In this case, you could have a CFO in the top right quadrant, a CTO in the top left, and then Managing Director in the bottom middle, to ensure you maintain a spread across all the competencies.
Coming back to the original challenge of building the optimal leadership team for a fast-growth business, the functional balance chart therefore enables CEOs and founders to see two things:
The Balance of the Team: Whether there is an even spread of experience and roles, or a concentration in certain areas.
The Balance of the Team: Whether there is an even spread of experience and roles, or a concentration in certain areas.
Role Suitability: How a leader’s experience compares to their role’s Functional Archetype, to assess both their suitability to the role, and/or the sub-type of the role they’re suited to, as well as how new hires can best complement their experience and approach.
If a founder or CEO recruits too much in his or her own image, and the team diverges too far from the optimal distribution set out above, then the chart will show a concentration of circles in one or more of the quadrants. This can potentially cause two problems:
Missing functional expertise in the team (empty quadrants)
For example, if a team is too concentrated in the ‘Revenue’ quadrant (Tactical & Creating Value), then the business is likely to suffer from a lack of sound and stable strategic trajectory, or effective operational systems (given the absence of leaders in the Strategic quadrants or the Operations quadrant). A team like this is also likely to be less flexible, due to less variety in expertise, complementary skills, and approaches.
2. A lack of delineated responsibilities
When several leaders are crowded together in a particular area of the chart, this tells us that despite holding different current roles, they have a very similar balance of functional experience, and expertise. This is likely to become apparent through less clear and cohesive leadership, along with a higher likelihood of confusion or unproductive competition about where certain aspects of the business ought to be taken.
That isn’t to say that every business should aim for the ‘ideal’ chart, which has leaders perfectly distributed within their four quadrants. Other important considerations are the stage of business growth, the industry sector, the business model, and the growth strategy which may mean that divergence from this ‘perfect’ model would be more appropriate.
For example, fast-growth businesses are increasingly focusing on digitalisation to drive growth and, where this is the case, you would want to see a higher proportion of leaders that land further into the Technology quadrant than their functional archetype, to ensure they understand and have experience in leveraging digitalisation and innovation to create long term value. On the flipside, this would be less important for a company not taking such a technologically focused trajectory.
Another example is in an early-stage company, a leadership team is more likely to be concentrated around the centre of the chart, as in this context leaders would usually need to operate across multiple functions, both due to budget considerations and a need for a highly agile approach. In this case, a more specialised Archetype candidate (positioned further away from the centre) is less likely to be appropriate.
Data is now central to so many strategic business decisions, but it is still not commonplace when building leadership teams. Yet, our 2021 Leadership Insights Report found that leadership is one of the biggest value-drivers for fast-growth businesses, with the best performing businesses more likely to make leadership change, make more change, and make change sooner.
The Functional Balance Chart is just one feature within the Leadership Dynamics product, which draws on data from every private equity transaction in the UK and Europe since 2010, to provide a benchmark of the key indicators of leadership success in these high-growth businesses. As a result, businesses can finally take a more scientific, data-driven approach to ensuring they have both the right functional leaders, as well as the right team of leaders, for a company’s sector, business model, and stage of growth. Thereby taking the guesswork out of leadership recruitment.
Samuel Robberts
Chief Product Officer, Leadership Dynamics

Whether you're an investor, investee or a part of a leadership team seeking to increase value creation, our strategic consultants are on hand to guide you through your leadership journey. Contact us today.
Savoy Hill House. 7 - 10 Savoy Hill
WC2R 0BU, London
+44870 770 0252
contact@thelcapgroup.com